Five tips on using Google Analytics
- January 3, 2013
- Google, Google Analytics, Product Review
Five things you should know about Google Analytics
Takeaway: Google Analytics is a free analysis service which measures website activity and performance. These five tips can help you get more out of it.
Google Analytics is an advanced technology which can help you measure how your company’s online marketing and presence is working. It gathers vast amounts of data and can serve as an EKG for your website so you can skip the supernatural shenanigans and get right to the core of what’s successful and what isn’t. With that in mind, here are five important things to know about Google Analytics.
1. It offers a variety of information for marketers, business analysts and IT staff
Right out of the starting gate you can use Google Analytics to investigate the following:
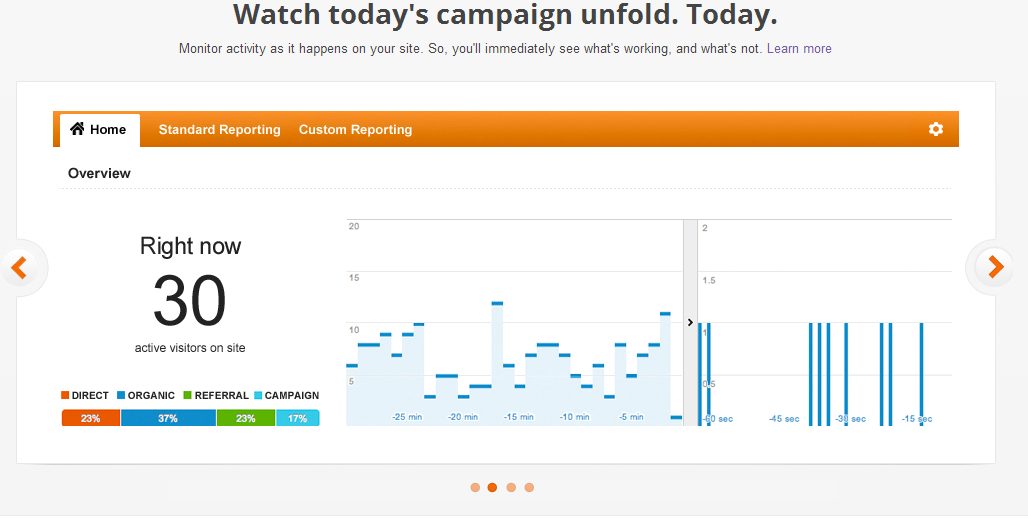
- How many visitors your site has at the moment
- Who has visited your site recently, and how many of these are unique or repeat visitors
- How often repeat visitors come back to your site
- How visitors get to your site (e.g. referral, ads, direct, links or email)
- What other sites are referring visitors to yours
- Where your visitors are coming from (e.g. the UK. or other countries)
- Which pages on your site have been visited the most
- How your site is faring in social networks; for instance how many +1s you’re getting on Google Plus, the number of Facebook Likes/Sends you receive or the volume of Twitter Tweets about your pages
- What is the “bounce rate” (the number of visitors who leave without examining other pages)
- The average time spent viewing your site
- What kind of browsers visitors are using
- The speed of the ISPs involved
2. It is easy to set up and doesn’t require you to host your website with Google
There is no cumbersome registration process to use Google Analytics, nor do you have to use their hosting service, update your DNS records or get on the phone with Google and prove your identity. For the basic setup all you have to do is sign up for the service then enter a string of code in your website’s page, or any subsidiary pages you want to analyze. Google will then start gathering data (note: more advanced features may require further setup). If you don’t administer your own site, we can help set this up for your on your sites.
To set up, click here to sign into Google Analytics. (Figure A)
Figure A
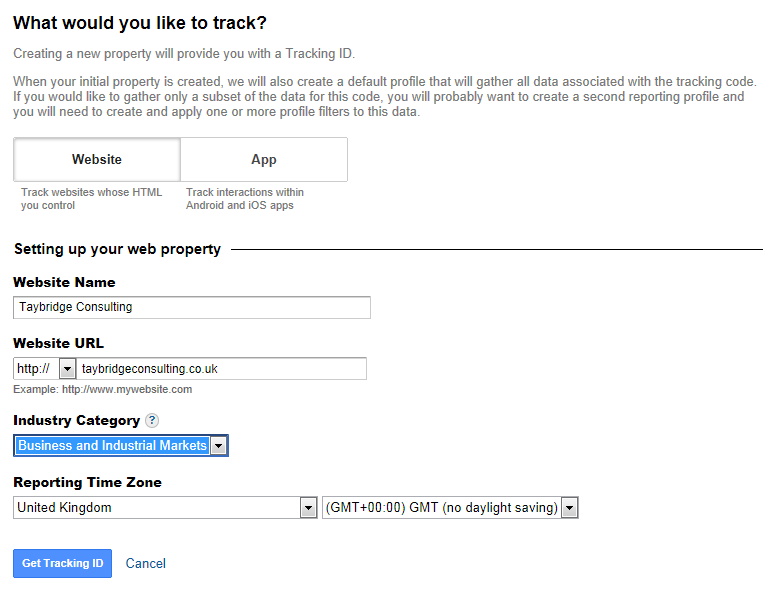
You then specify what you want to track and how. (Figure B)
Figure B
In the example shown, I’ll set up a website, but you can also track mobile applications. Google provides a best practices guide to cover this category.
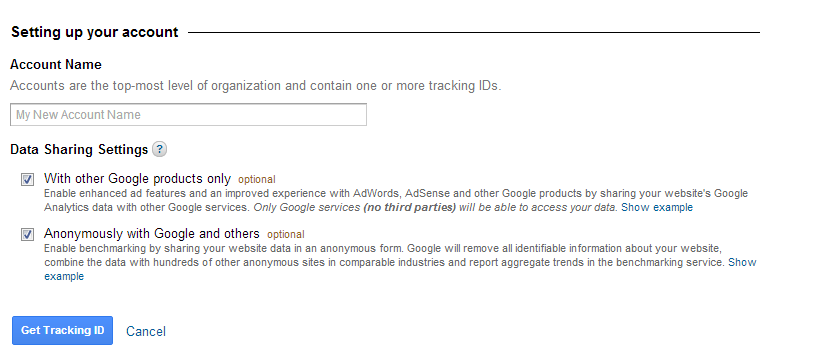
Enter your website information as shown above, and then configure account settings at the bottom of the same page. (Figure C)
Figure C
Read and accept the TOS then click Accept and you’ll get a tracking code at the next screen. (Figure D)
Figure D
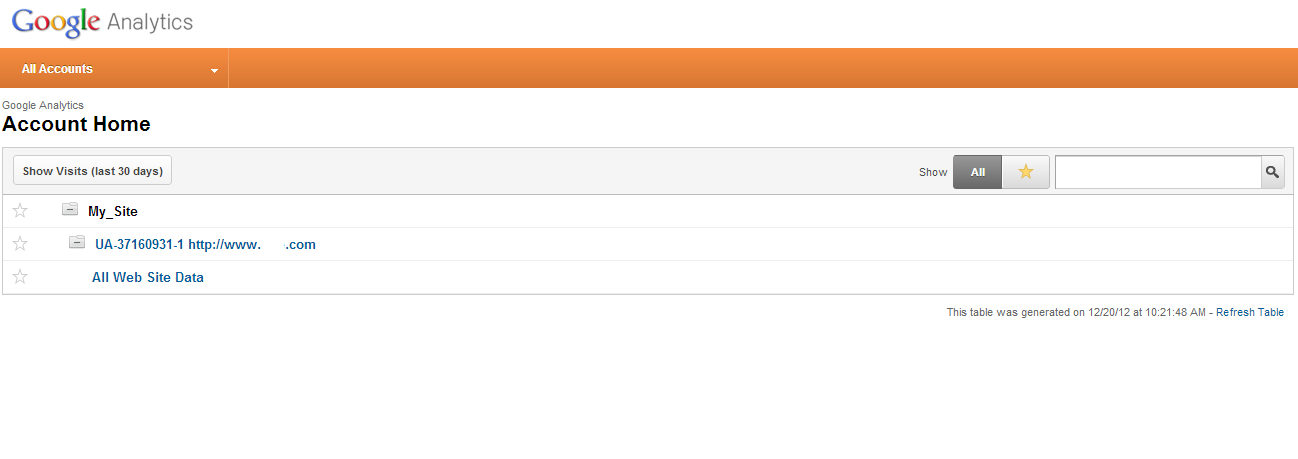
Your Account Home Page will then be shown. Click your site and it will expand to provide a link underneath called “All Web Site Data.” (Figure E)
Figure E
Click “All Web Site Data” to see the statistics you can track once the data becomes available; this takes you to the “Standard Reporting” section. (Figure F)
Figure F
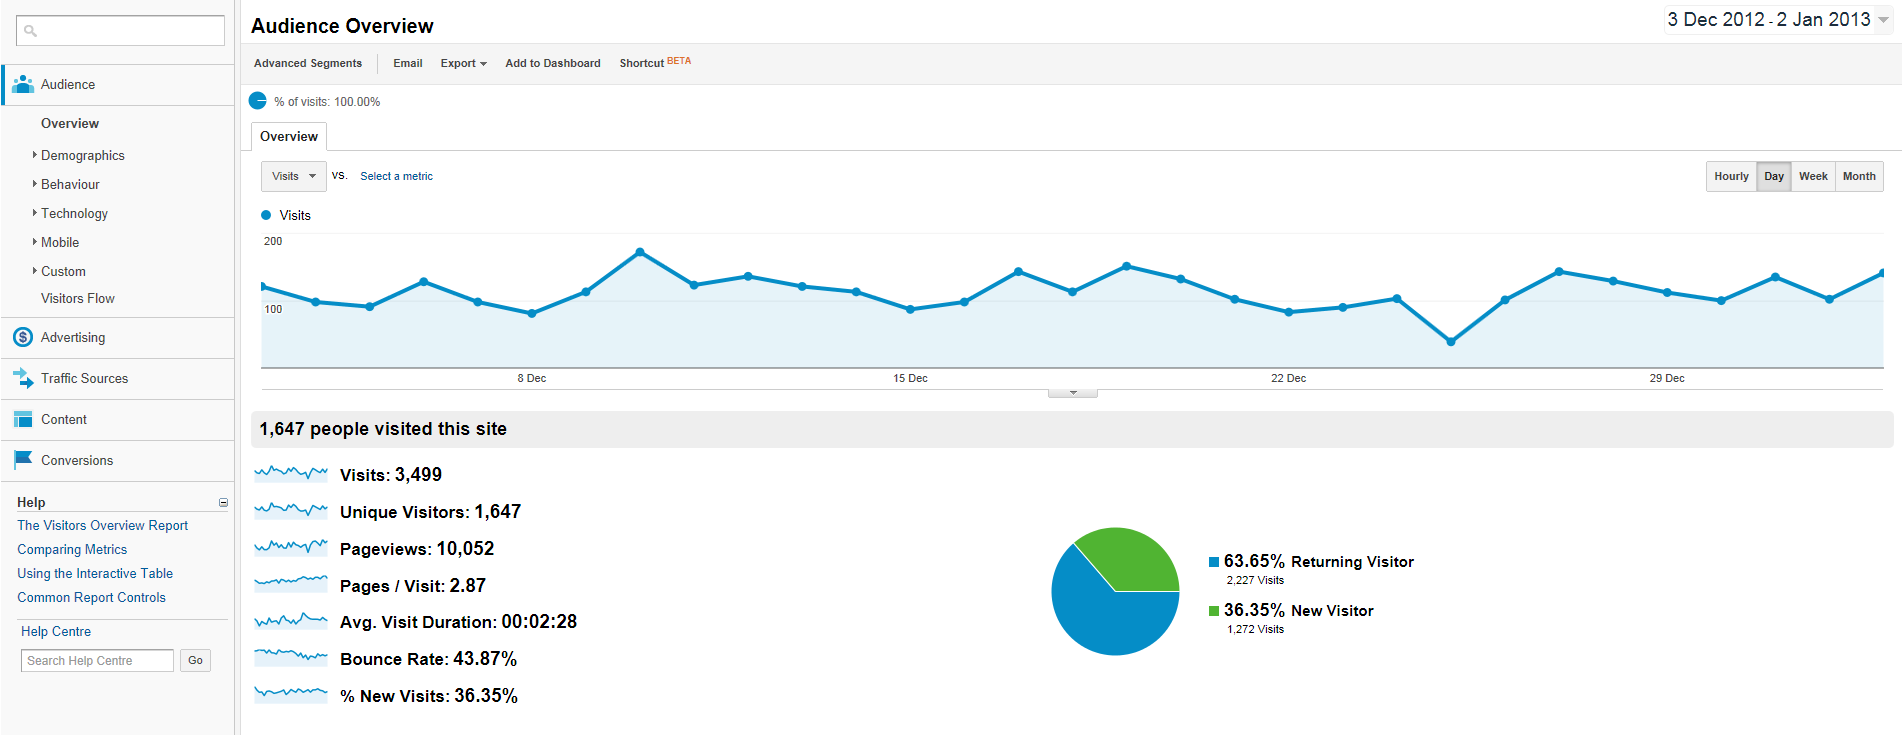
Note that the “Audience” section has numerous options underneath which you can use to view data – and you can search the menus too. (Figure G)
Figure G
Advertising, Traffic Sources, Content and Conversions can be expanded as well to utilize the more advanced options available underneath.
3. Google offers both free and paid versions of Analytics
The basic version of Google Analytics is free (to be fair, however, keep in mind that a free product from Google may not necessarily remain forever free; there is no longer a free version of Google Apps available for new business customers for instance).
Google Analytics Premium is the advanced (read: paid) version of the product. It offers direct support, account management, hands-on implementation assistance, greater data processing/limits capacities, and more.
The free version “samples” data, meaning you get more of an average of the statistics – you might not see the accurate hit count on a very busy website for instance. The premium version gives you more accurate results.
Interestingly, the premium edition is available for a flat fee of $150K per year, which obviously puts it in the realm of large enterprises with plenty of capital. There is no mid-tier paid version at present.
Google provides a chart showing the full differences between the free and premium versions.
4. It can show you at a glance how your site or your ad campaign, search engine activity or other strategies are working so you can make immediate adjustments
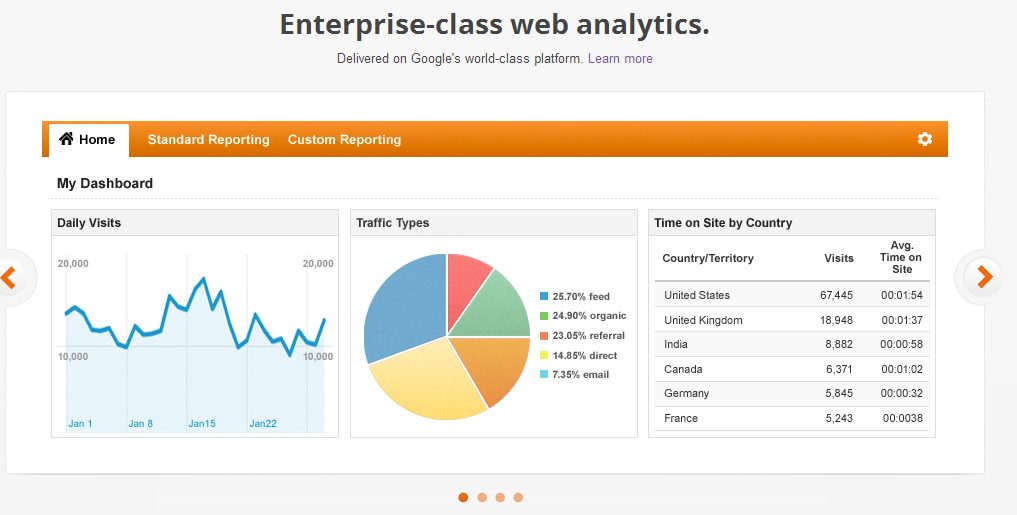
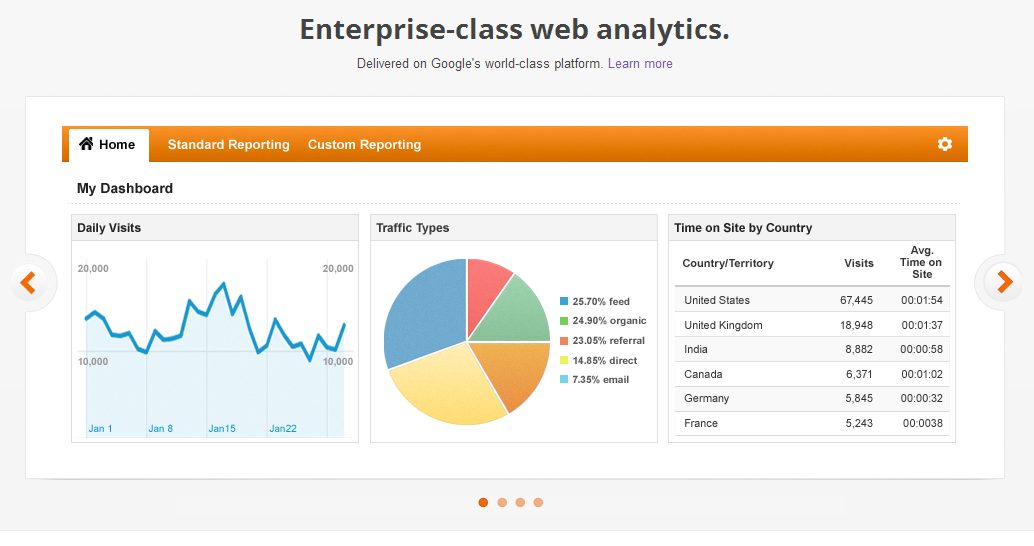
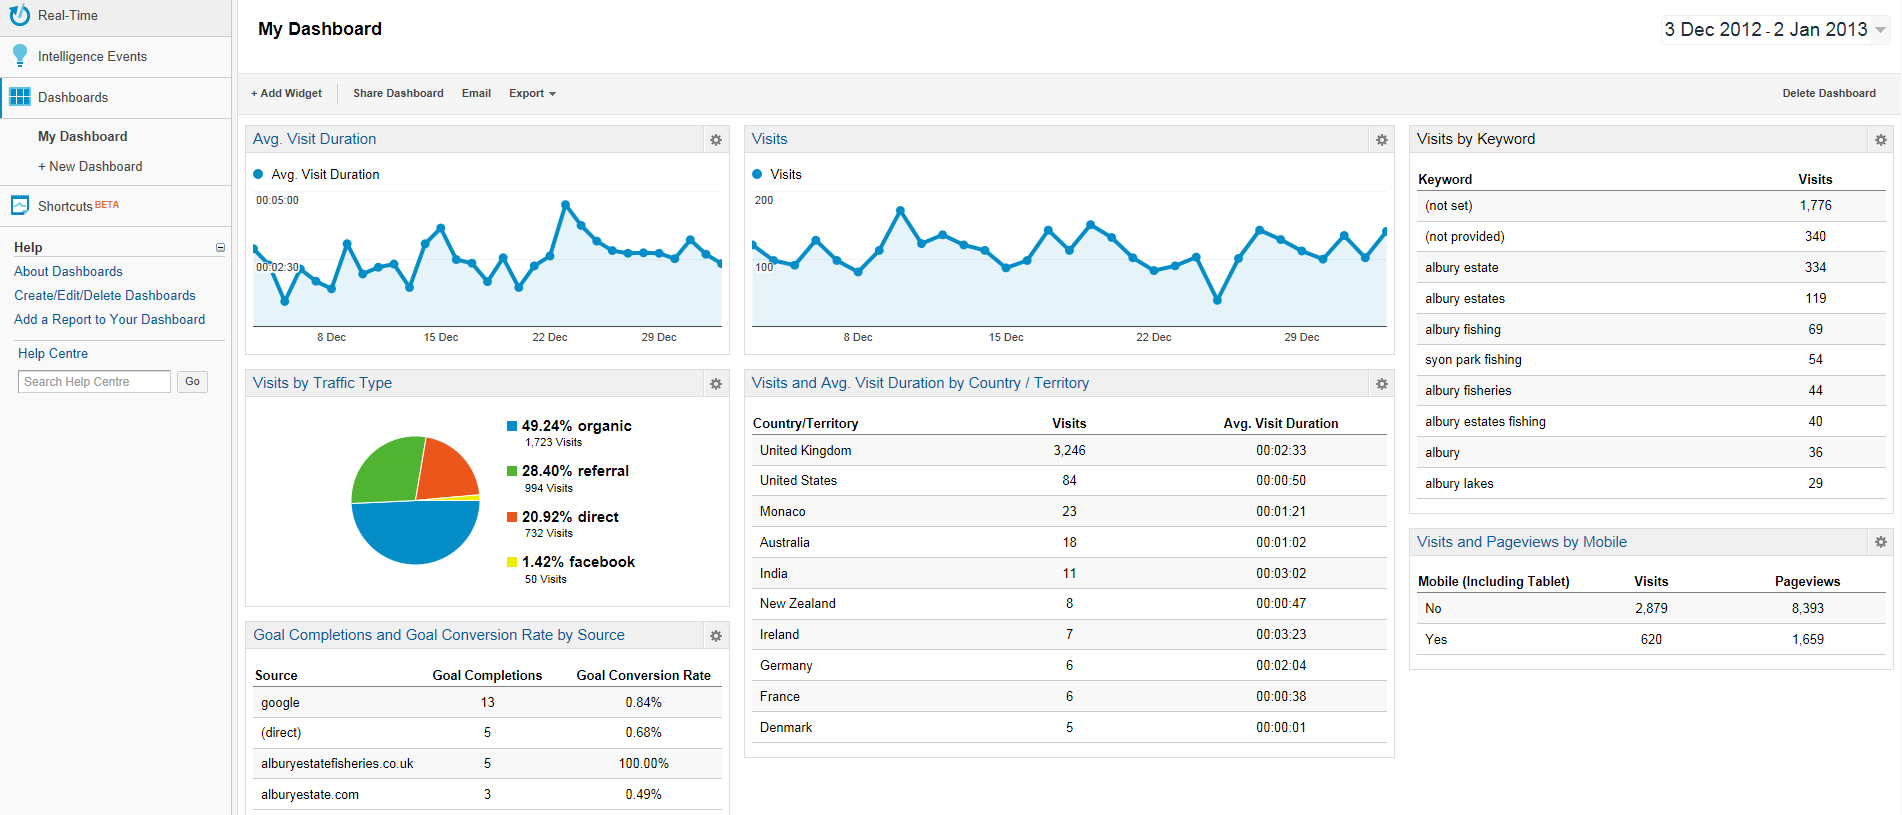
Google Analytics provides customizable dashboards you can use to display the data you’re most interested in. You configure the dashboard using widgets, which are data categories that show certain information (Visits, Bounce Rate, Visits by Language, etc.)
Below (Figures H through K) are several examples of how the dashboard has been configured for basic traffic analysis.
Figure H
Figure I
Figure J
Figure K
Google states “You can create up to 20 dashboards, and each dashboard can contain up to 12 widgets.”
To create a new dashboard, at the Home screen, expand “Dashboard” in the left column (Figure L) and then click New Dashboard.
Figure L
In the screenshot above I’ve selected a “Blank Canvas” (the “Starter Dashboard” will create an elementary dashboard for you with many Visit-related details) and entered the name “Marketing Dashboard” as an example. If I click “Create Dashboard” I can then add Widgets as shown in Figure M.
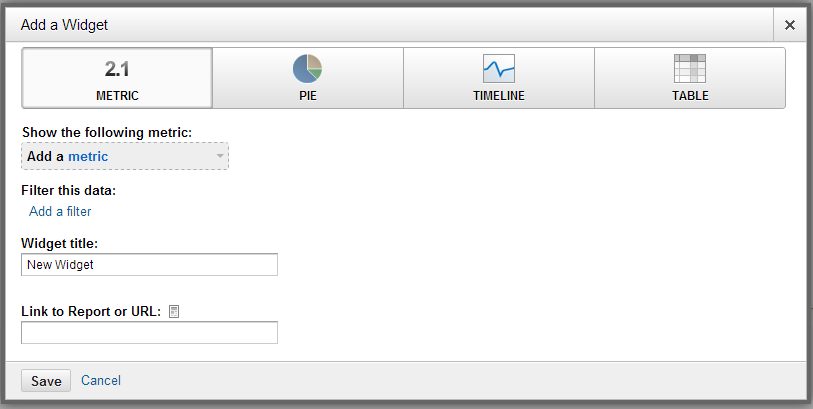
Figure M
Widgets are built using metrics, and can display information directly or in pie/timeline/table format for visual appeal. There are over 200 available metrics, such as “Ad Plays,” “Ad Sense Ads Clicked,” “Cost per Transaction,” “Impressions” (the number of times your search ads were displayed), “Product Revenue,” “ROI,” “Total Abandonment Rate” and so forth. You can also add filters to streamline the results further, for instance to only show a certain kind of data.
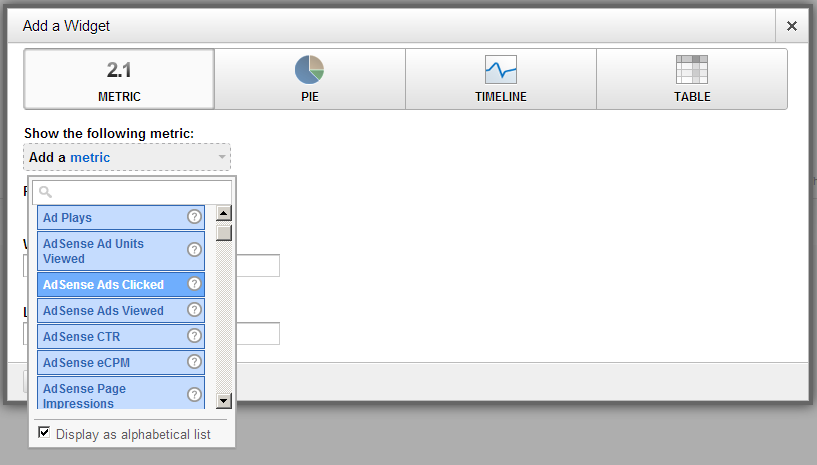
Let’s say I’m using AdSense and want to create a dashboard with widgets showing the results. I would click “Add a metric.” (Figure N)
Figure N
I can then select “AdSense Ads Clicked” and click Save.
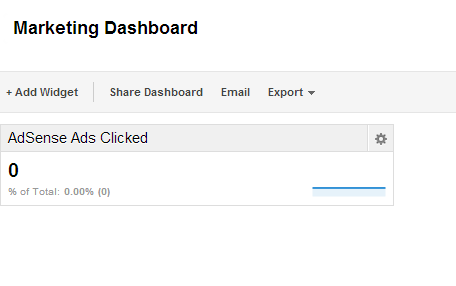
My Dashboard now shows the new widget. (Figure O)
Figure O
You can edit widgets using the gear-like settings icon in the upper right or you can click “Delete widget” in the box to remove them from the dashboard. You can add more widgets using the “Add Widget” button in the toolbar.
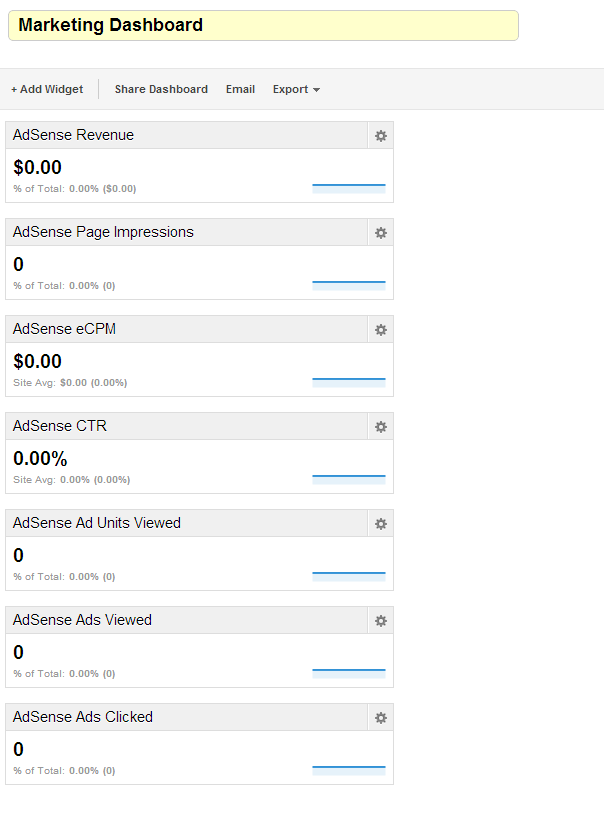
If I add all relevant AdSense metrics, I’ll have a dashboard that resembles Figure P.
Figure P
(Granted, there isn’t any data there yet, but this shows how you would group the information you want to see in the dashboard.)
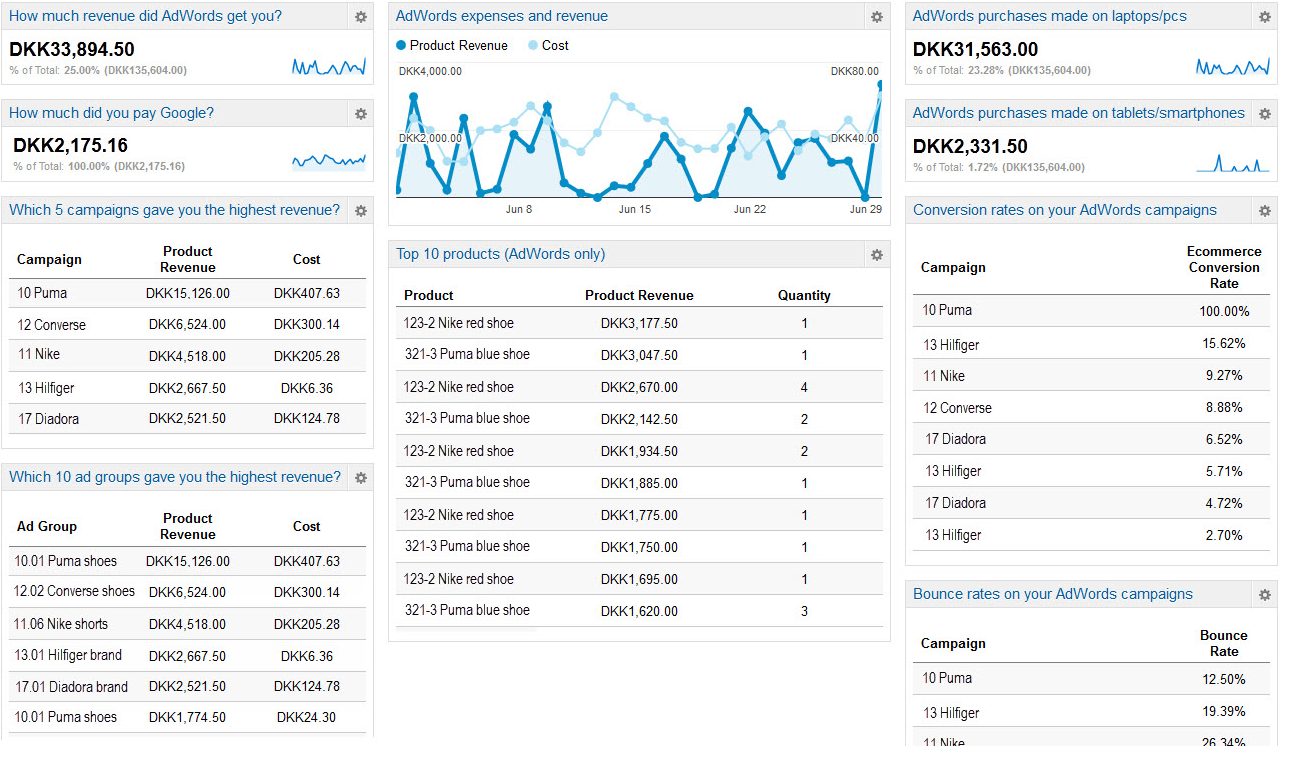
This sample dashboard (Figure Q) from www.dashboardjunkie.com offers a glimpse of how AdWords is performing for a company selling athletic wear:
Figure Q
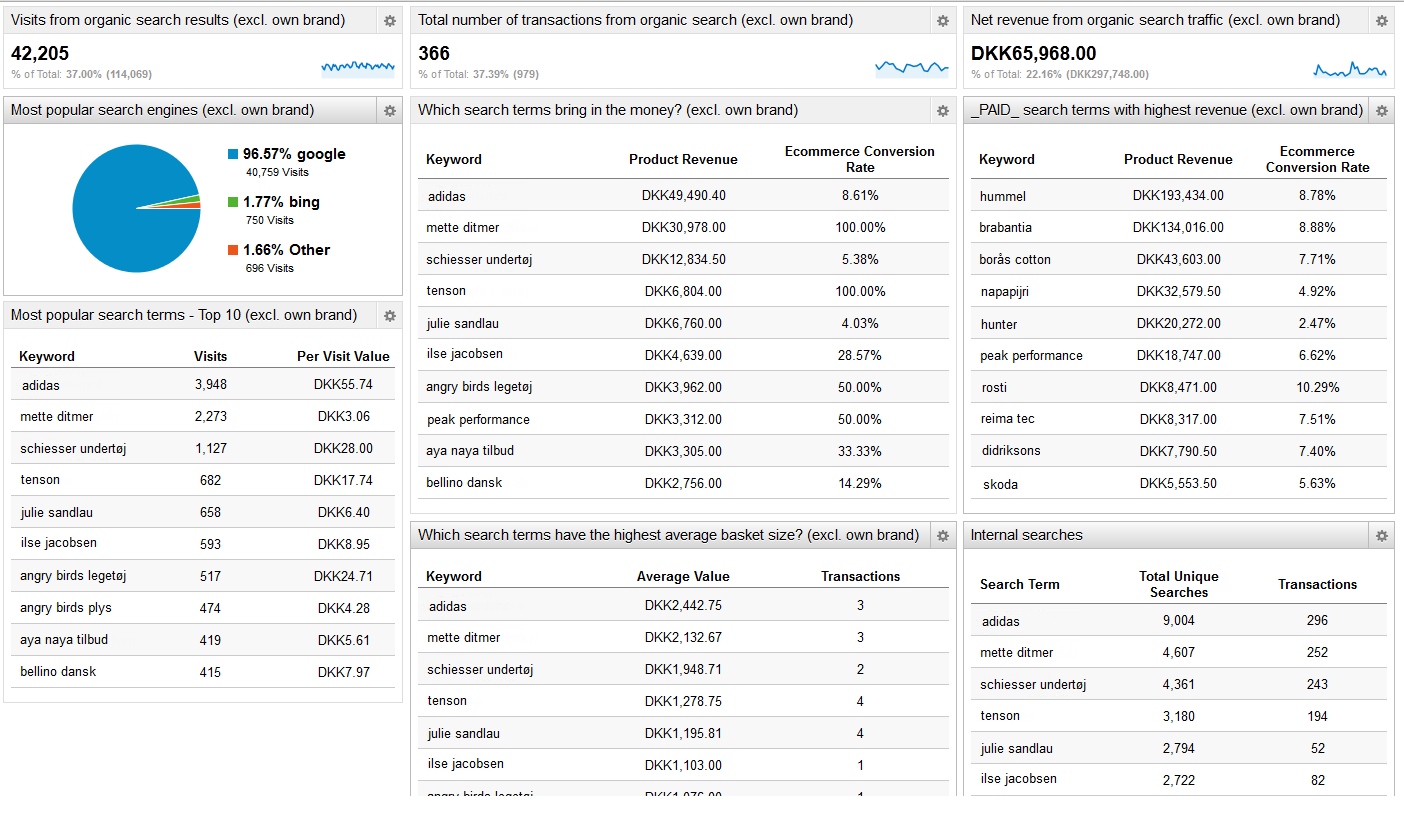
Want to see how search terms are generating revenue? Dashboard Junkie gives us another example. (Figure R)
Figure R
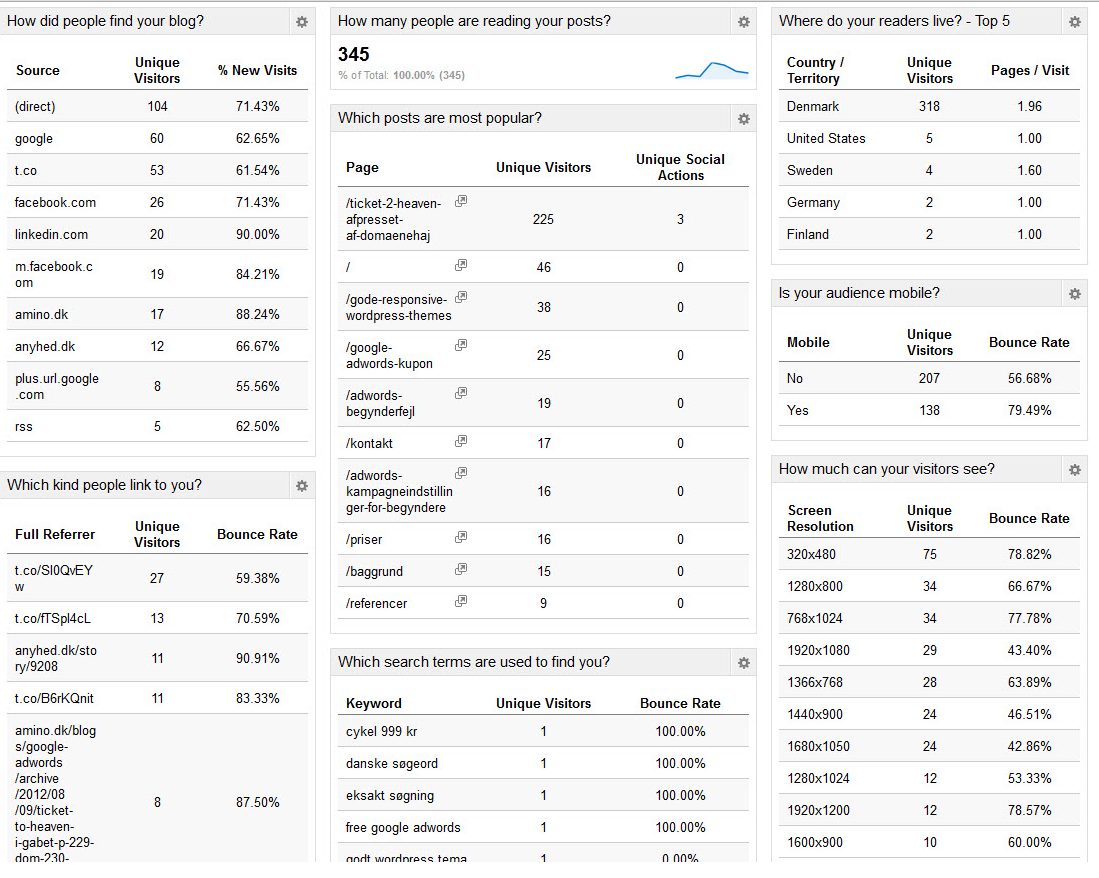
Let’s say you’re a blogger and you’d like to review stats regarding your site. Again, Dashboardjunkie.com provides a sample. (Figure S)
Figure S
You can use dashboards to analyze mobile e-commerce traffic, social media interactions and numerous other key areas of interest. You can even share dashboards with other Google Analytics users and vice versa; Google offers some dashboards and apps to meet various needs.
This is just a start. Analytics-review.com has a useful tutorial offering more information on dashboards. You can also learn how to create the Perfect Google Analytics Dashboard.
5. You can put in a little or a lot; there are plenty of newbie and expert options
Right now, hopefully, you have enough information to get off the ground using Google Analytics. However, I’ve only covered the proverbial tip of the iceberg. There are many more options and features available, such as:
- You can set up goal conversions, which measure business objectives such as how many users have registered with your site or downloaded a file, to track results over time. It’s possible to examine data spreading out over hours, days, weeks, months, etc. Google provides you with 20 goals per profile in the free Google Analytics (you can use multiple profiles for multiple users).
- If you use AdWords, the data can be linked to your Google Analytics profile and provide you with relevant reports. It can also show you information regarding any ads you may have within the Google Display Network.
- You can access e-commerce data involving product performance, sales performance, transactions and time to purchase.
- You can use Advanced Segmentation to drill down into the kind of traffic you’re getting to your site.
- If you’re the website administrator, you can examine site speed, page load time, and other factors which are useful to you to determine whether the server is handling traffic demands.
- You can set up Mobile App Analytics to examine interactions with your site from mobile devices.
- Google has an Adwords blog you can check out. You can view tutorial presentations for their “Google Analytics Individual Qualification test.” Finally, some great tips can be found in this article titled “50 Resources for Getting the Most out of Google Analytics.”
In summary, Google Analytics can perform magic for you with proper set-up care, and feeding. It is an essential tool for monitoring Website performance, visitors numbers and their interaction with the site. It is critical part of the Taybridge Consulting 4M philosophy of website development.
About us and this blog
We are a digital marketing company with a focus on helping our customers achieve great results across several key areas.
Request a free quote
We offer professional SEO services that help websites increase their organic search score drastically in order to compete for the highest rankings even when it comes to highly competitive keywords.


